Results for 6bgi
EMD-7095
Membrane mimetics: nanodisc;


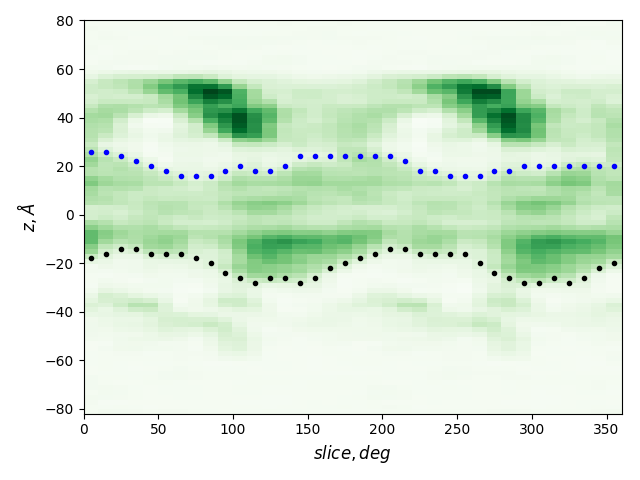
Cross-sections at different angles
green: density, gray dots: atoms from the all-atom model, lines: membrane boundaries defined by TMDET
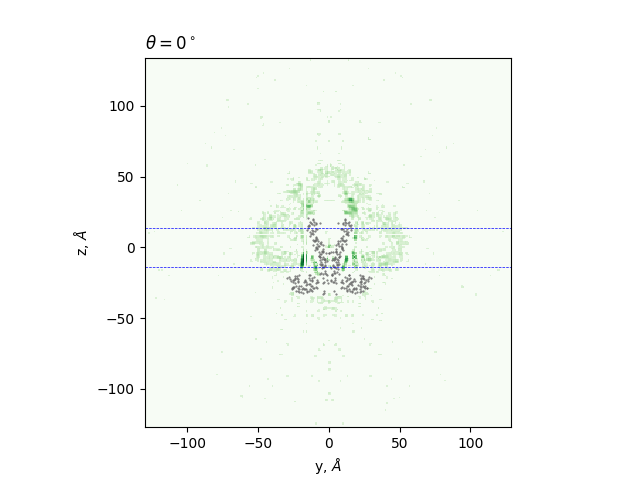
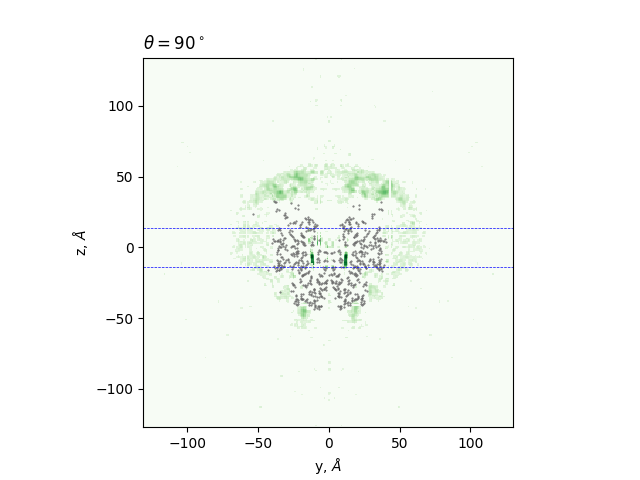
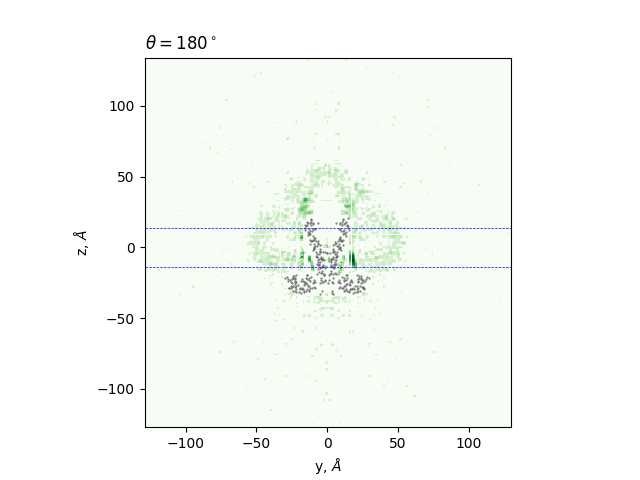
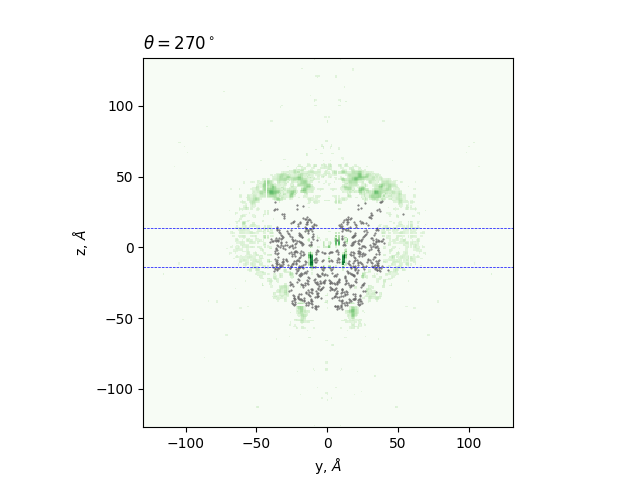
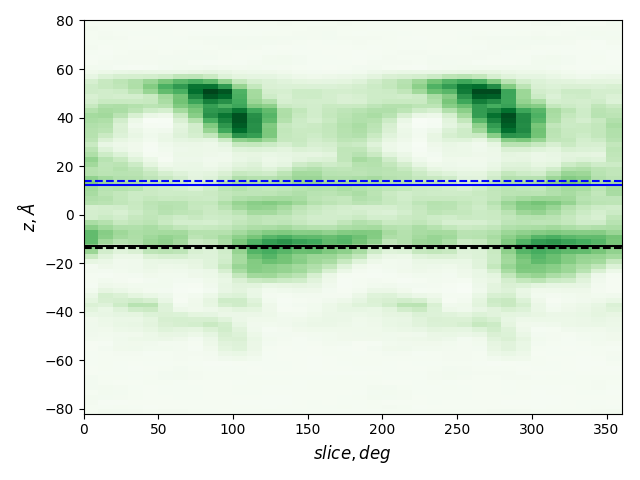
The determined edges at each slice and their comparison to TMDET
dots: edges of the gradient, triangles: outliers,
dashed and solid lines: membrane boundaries defined by TMDET and MemBlob ( mean(Zi) decreased by the thickness of the interface region (8 Å))
[ Download results
Resubmit ]
Manual settings applied
140-190 end1 around 25 3
320-350 end1 around 20 3
100 end0 average 90 110
110 end1 average 100 120
280 end0 average 270 290
0 end1 equal 10
280 end1 equal 270
290 end1 equal 300
Boundary values (averages for MemBlob)
| Z (PDBTM) | Z (MemBlob) | Z - 8 | |
| End1 | 13.75 | 20.22 | 12.22 |
| End0 | -13.75 | -20.78 | -12.78 |
Mapping the results to the structure
You can move/scale/rotate the structure.
Blue: a.a. facing to bulk water;
magenta: interface region;
green: a.a. interacting with the hydrophobic membrane core;
yellow: burried a.a.
red: a.a. with an invisible side chain and non-protein molecules, for which DSSP cannot return SASA
[ Download results
Resubmit ]