Results for 6fn1
EMD-4281
Membrane mimetics: amphipol; Note: There is a very small blob


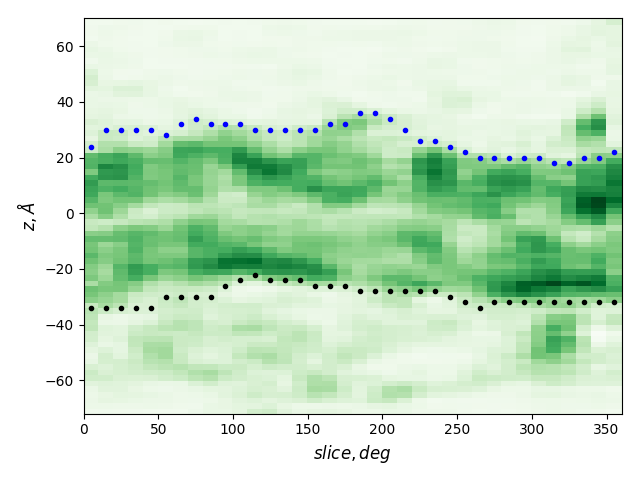
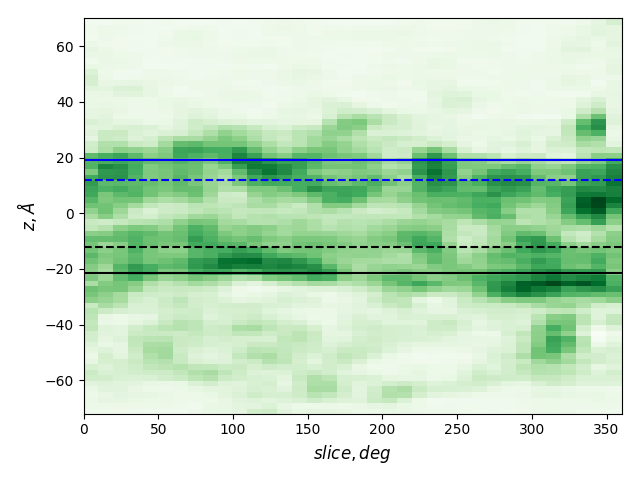
Cross-sections at different angles
green: density, gray dots: atoms from the all-atom model, lines: membrane boundaries defined by TMDET
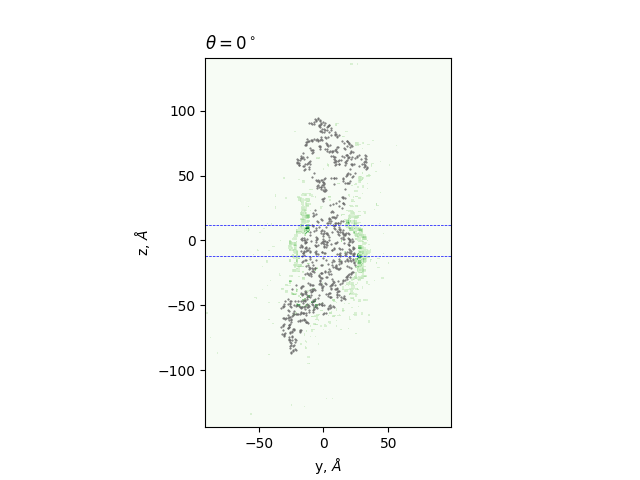
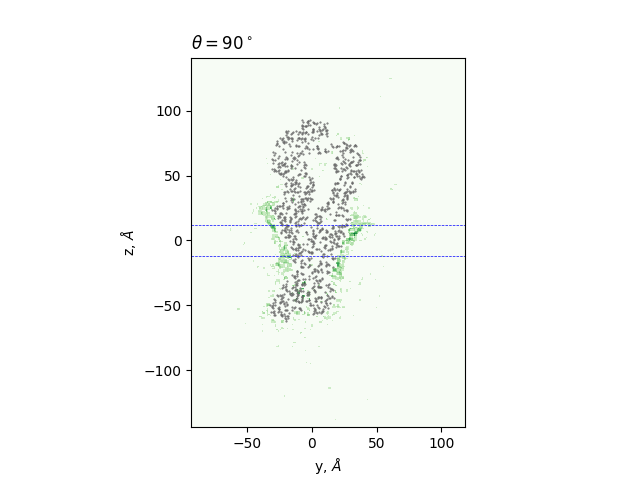
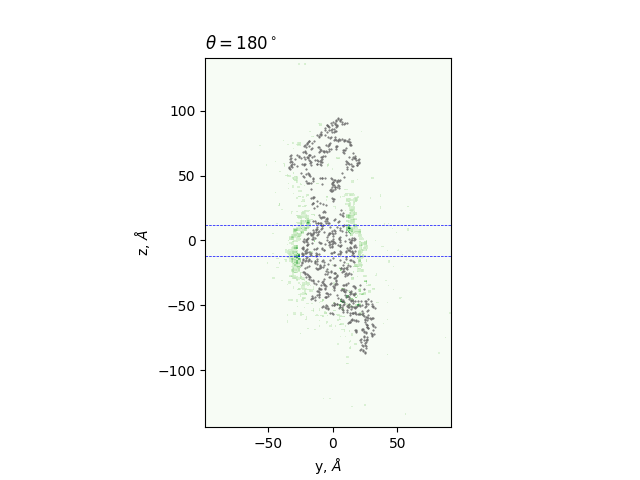
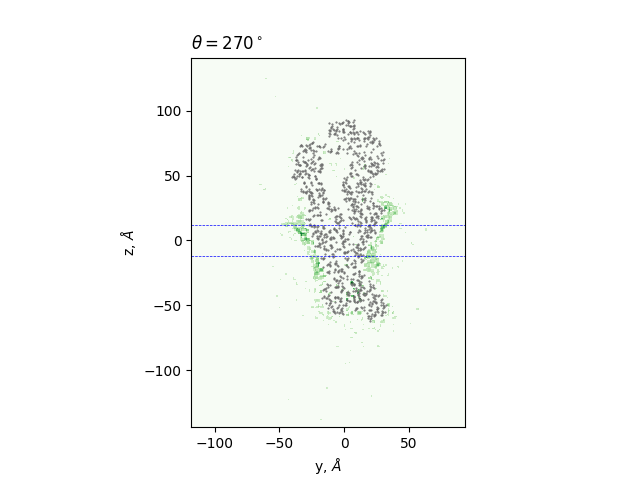
The determined edges at each slice and their comparison to TMDET
dots: edges of the gradient, triangles: outliers,
dashed and solid lines: membrane boundaries defined by TMDET and MemBlob ( mean(Zi) decreased by the thickness of the interface region (8 Å))
[ Download results
Resubmit ]
Manual settings applied
10 end1 equal 20
160,170 end1 average 150 180
210 end1 average 200 220
290 end1 average 280 300
310 end1 average 300 320
330,340 end1 average 320 350
0 end0 equal 10
50-80 end0 around -30 2
190-210 end0 average 180 220
250 end0 average 240 260
270-350 end0 around -30 2
Boundary values (averages for MemBlob)
| Z (PDBTM) | Z (MemBlob) | Z - 8 | |
| End1 | 12.00 | 27.22 | 19.22 |
| End0 | -12.00 | -29.56 | -21.56 |
Mapping the results to the structure
You can move/scale/rotate the structure.
Blue: a.a. facing to bulk water;
magenta: interface region;
green: a.a. interacting with the hydrophobic membrane core;
yellow: burried a.a.
red: a.a. with an invisible side chain and non-protein molecules, for which DSSP cannot return SASA
[ Download results
Resubmit ]